Questões de Concurso
Para analista de geoprocessamento
Foram encontradas 291 questões
Resolva questões gratuitamente!
Junte-se a mais de 4 milhões de concurseiros!
Considere as seguintes afirmações a respeito dos mapas temáticos:
I. Os produtos da cartografia temática são as cartas, mapas ou plantas em qualquer escala, destinadas a um tema específico. A representação temática, distintamente da geral, exprime conhecimentos particulares específicos de um tema (geologia, solos, vegetação etc.) para uso geral.
II. Os elementos primários do tema que será elaborado cartograficamente podem ser originários da técnica estatística, tanto no que se referem aos elementos físicos, quanto aos elementos humanos. Assim, se caracterizam nesta área, os mapas de densidade, os de distribuição por pontos, os de fluxo, os pluviométricos e os mapas de isolinhas.
III. Objetivam a representação cartográfica do Território Nacional, enfatizando a divisão político-administrativa. São mapas e cartogramas políticos Nacional, Regionais, Estaduais e Municipais.
Considere as afirmações a seguir sobre o espectro de radiação eletromagnética:
I. A pequena banda denominada luz compreende o conjunto de radiações para as quais o sistema visual humano é sensível.
II. Todos os comprimentos de onda são igualmente efetivos para o propósito do sensoriamento remoto.
III. Os comprimentos de onda do azul sofrem substancial atenuação pelo espalhamento atmosférico.
IV. A aparência verde da folha, e por extensão da vegetação, está relacionada com a maior absorção na banda verde e é produzida pela clorofila.
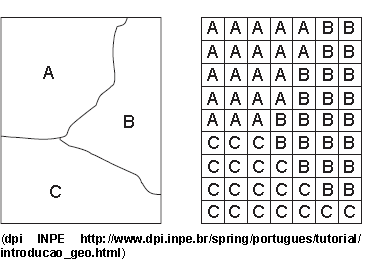
Considere a imagem abaixo.

De acordo com a imagem,
Considere as afirmações abaixo que tratam da comparação entre SIG e CAD.
I. Um sistema CAD é uma ferramenta para capturar desenhos em formato legível por uma máquina. Os modelos CAD tratam os dados como desenhos eletrônicos em coordenadas do papel.
II. Em um sistema de geoprocessamento os dados estão sempre georreferenciados, isto é, localizados na superfície terrestre. Na maioria dos casos os dados estão em projeção cartográfica, o que impõe uma distorção relativa às coordenadas geográficas.
III. Armazenar a topologia de um mapa é uma das características básicas que fazem um SIG se distinguir de um CAD. Topologia pode ser definida como a estrutura de relacionamentos espaciais (vizinhança, proximidade, pertinência) que podem se estabelecer entre objetos geográficos.
Considere a frase:
... descrevem a distribuição espacial de uma grandeza geográfica, expressa de forma qualitativa, como os mapas de pedologia e a aptidão agrícola de uma região. Esses dados são inseridos no sistema por digitalização ou, a partir de classificação de imagens.” (CÂMARA, et al.)
Os tipos de dados utilizados em geoprocessamento descritos na frase são:
Ao escolher as ferramentas de sensoriamento para uma aplicação é necessário levar-se em conta quesitos técnicos como as características dos sensores e seu custo-benefício. Considere produtos de sensoriamento remoto e as atividades.
Produtos de sensoriamento remoto
1. Fotografias aéreas.
2. Satélites NOAA.
3. Satélites da série SPOT.
4. Satélites da série LANDSAT.
Atividades
I. Cartografia de precisão.
II. Elaboração de modelos climáticos e previsão do tempo.
III. Levantamento histórico de uso das terras de longa abrangência temporal.
IV. Levantamento de cobertura vegetal em grande extensão de território.
Sobre as interações é correto afirmar:
A rede geográfica é formada pelas linhas de referência que cobrem o Globo Terrestre permitindo a localização precisa de qualquer ponto sobre sua superfície, bem como orientar a confecção de mapas. Sendo assim, considere as afirmações abaixo.
I. As linhas dispostas no sentido norte-sul recebem o nome de meridianos.
II. Apenas o meridiano de Greenwich passa pelos dois polos geográficos da Terra.
III. Paralelos são assim denominados por serem paralelos ao eixo de rotação da Terra.
IV. O Equador é o paralelo perpendicular ao eixo da Terra equidistante dos polos geográficos.
Considere as definições abaixo com relação a Cartografia:
I. .... é a representação no plano, normalmente em escala pequena, dos aspectos geográficos, naturais, culturais e artificiais de uma área tomada na superfície de uma Figura planetária, delimitada por elementos físicos, político-administrativos, destinada aos mais variados usos, temáticos, culturais e ilustrativos.
II. .... é a representação no plano, em escala média ou grande, dos aspectos artificiais e naturais de uma área tomada de uma superfície planetária, subdividida em folhas delimitadas por linhas convencionais − paralelos e meridianos − com a finalidade de possibilitar a avaliação de pormenores, com grau de precisão compatível com a escala.
III. .... representa uma área de extensão suficientemente restrita para que a sua curvatura não precise ser levada em consideração, e que, em consequência, a escala possa ser considerada constante.
Analise o quadro a seguir com as equidistâncias das curvas de níveis intermediárias e mestras.

Os itens I, II, III, IV e V correspondem, correta e respectivamente, a