Questões de Concurso
Para agente técnico - estatístico
Foram encontradas 81 questões
Resolva questões gratuitamente!
Junte-se a mais de 4 milhões de concurseiros!
1. Global warming is an increase in earth’s temperature. 2. Renewable energy is a natural and unlimited source of power. 3. Climate change is severe climate events such as tornados. 4. Ozone layer is a kind of wind power.
Choose the alternative which contains the correct afirmative:
1. Global warming is an increase in earth’s temperature. 2. Renewable energy is a natural and unlimited source of power. 3. Climate change is severe climate events such as tornados. 4. Ozone layer is a kind of wind power.
Choose the alternative which contains the correct affirmative:
Today, it seems that no one is uninformed about the environment. Every day the media shows us more evidence of climate change: extreme weather, melting ice-caps, and rising seas. Most of us believe we can do something to prevent global disaster, such as recycling, or conserving energy. It’s strange to recall that, before the 1960s, few people knew of the damagewe were doing to the planet. However, one scientist had already realized the dangers ahead. And today, this same man believes it may be too late to save the world. In the 1960s, Professor James Lovelock came up with one of the most famous theories on the environment – the GAIA hypothesis. According to this hypothesis, the earth’s atmosphere, soil, and oceans work in concert to provide an inhabitable environment for humans. If we disrupt these elements too severely, the earth may one day become uninhabitable. In the decade before he developed the Gaia hypothesis, Lovelock had created a device to detect atmospheric chemicals. With this device, he discovered particular chemicals, called CFCs. Later, other scientists discovered that these CFCs had damaged the earth’s ozone layer. Before then, we hadn’t knows about the hole in the ozone layer. By 1979, Lovelock had put forward his theories on the environment, in his first book. At that time, few people believe him. Before scientists such as Lovelock publicized environmental issues, the environment hadn’t been a very fashionable topic. In 2004, after many people had only just started to accept the reality of global warming, Lovelock became convinced that climate change was irreversible. In 2006, he wrote another book describing his latest ideas. In 40 years, Lovelock believes large parts of the world will be desert. We will need to make synthesized food to feed the world’s population. ‘Is Lovelock right this time too? Surely we can prevent this nightmare, if we all recycle, use renewable energy, and travel less by plane and car? Lovelock disagrees. According to him, it is now impossible to reverse global warming. We did not act quickly enough when we had the chance. Renewable energy and recycling are a case of too little, too late. Ultimately, if the human race is to survive, Lovelock believes we need to use more technology, not less. In his view, only nuclear energy can provide sufficient power for the planet. Now over 90 years old, Lovelock may not live to find out if he is right. But we will...
About Professor James Lovelock, it is correct to state that:
Today, it seems that no one is uninformed about the environment. Every day the media shows us more evidence of climate change: extreme weather, melting ice-caps, and rising seas. Most of us believe we can do something to prevent global disaster, such as recycling, or conserving energy. It’s strange to recall that, before the 1960s, few people knew of the damagewe were doing to the planet. However, one scientist had already realized the dangers ahead. And today, this same man believes it may be too late to save the world. In the 1960s, Professor James Lovelock came up with one of the most famous theories on the environment – the GAIA hypothesis. According to this hypothesis, the earth’s atmosphere, soil, and oceans work in concert to provide an inhabitable environment for humans. If we disrupt these elements too severely, the earth may one day become uninhabitable. In the decade before he developed the Gaia hypothesis, Lovelock had created a device to detect atmospheric chemicals. With this device, he discovered particular chemicals, called CFCs. Later, other scientists discovered that these CFCs had damaged the earth’s ozone layer. Before then, we hadn’t knows about the hole in the ozone layer. By 1979, Lovelock had put forward his theories on the environment, in his first book. At that time, few people believe him. Before scientists such as Lovelock publicized environmental issues, the environment hadn’t been a very fashionable topic. In 2004, after many people had only just started to accept the reality of global warming, Lovelock became convinced that climate change was irreversible. In 2006, he wrote another book describing his latest ideas. In 40 years, Lovelock believes large parts of the world will be desert. We will need to make synthesized food to feed the world’s population. ‘Is Lovelock right this time too? Surely we can prevent this nightmare, if we all recycle, use renewable energy, and travel less by plane and car? Lovelock disagrees. According to him, it is now impossible to reverse global warming. We did not act quickly enough when we had the chance. Renewable energy and recycling are a case of too little, too late. Ultimately, if the human race is to survive, Lovelock believes we need to use more technology, not less. In his view, only nuclear energy can provide sufficient power for the planet. Now over 90 years old, Lovelock may not live to find out if he is right. But we will...
Choose the correct alternative according to the text.
Professor James Lovelock thinks...
“By 1979, Lovelock had put forward his theories on the environment, in his first book.”
The word “his” is used twice. In both cases it refers to:
( ) Many people thought about the environment before the 1960s. ( ) Most scientists knew about global warming in the 1960s. ( ) Professor Lovelock found chemicals called CFCs in the atmosphere. ( ) Lovelock wrote a book in 2006.
Choose the alternative that presents the correct order from top to bottom:
 é a variável estudada,
  é frequência absoluta,
  a frequência acumulada e
  a frequência relativa.
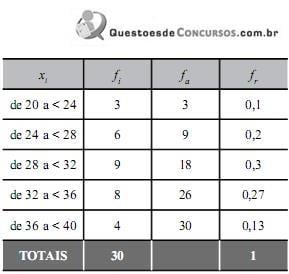
De acordo como os dados da tabela, ao se calcular o valor do terceiro quartil, verifica-se que
 (onde
(onde  é o desvio absoluto de uma variável
  em relação à média e
  a sua frequência) apresentou o total 416. Se o desvio-padrão dessa amostra é de 4, então, o número de dados analisados é:
  dos dados analisados e, no eixo vertical, os valores
  da frequência acumulada.
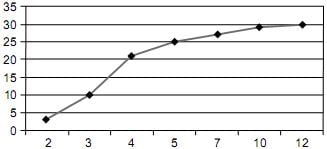
Por esse gráfico, é correto afirmar que
O diagrama de dispersão a seguir resulta de uma pesquisa com amostras aleatórias para comparar níveis de escolaridade (em anos de estudo) com a lotação média (em percentual) das salas de teatro das localidades de onde as amostras aleatórias foram colhidas. A disposição dos dados no diagrama de dispersão parece indicar que há correlação entre as variáveis estudadas. De fato, calculando-se o coeficiente de correlação, encontra-se r = 0,93. Está representada, ainda, no diagrama, a reta de regressão y = a + bx, onde x é o tempo médio de escolaridade e y a lotação média das salas de teatro.
Anos de Escolaridade x lotação de salas de teatro
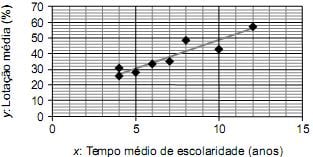
A equação da reta de regressão que melhor se ajusta aos dados é
O diagrama de dispersão a seguir resulta de uma pesquisa com amostras aleatórias para comparar níveis de escolaridade (em anos de estudo) com a lotação média (em percentual) das salas de teatro das localidades de onde as amostras aleatórias foram colhidas. A disposição dos dados no diagrama de dispersão parece indicar que há correlação entre as variáveis estudadas. De fato, calculando-se o coeficiente de correlação, encontra-se r = 0,93. Está representada, ainda, no diagrama, a reta de regressão y = a + bx, onde x é o tempo médio de escolaridade e y a lotação média das salas de teatro.
Anos de Escolaridade x lotação de salas de teatro
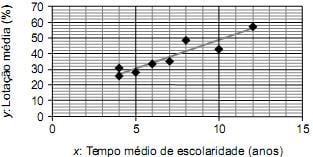
O coeficiente de determinação para o caso é, aproximadamente,
Muito embora seja algo que se intensifica desde os anos 1960, a vinda de imigrantes bolivianos para o Brasil tem chamado atenção nos últimos anos. O quadro a seguir, publicado no jornal Folha de S.Paulo, de 7 de julho de 2013, mostra, entre outros dados, a evolução da imigração boliviana para o Brasil entre 1960 e 2000. Acrescente a essas informações o fato de que a população brasileira em 2000, segundo estimativas do IBGE (Instituto Brasileiro de Geografia e Estatística), era de cerca de 170 milhões de habitantes, contando brasileiros e estrangeiros.
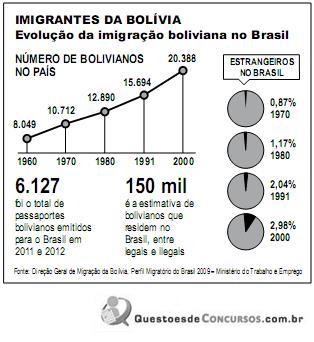
Analisando-se os períodos de imigração boliviana descritos no gráfico – NÚMERO DE BOLIVIANOS NO PAÍS –, verifica-se que
Muito embora seja algo que se intensifica desde os anos 1960, a vinda de imigrantes bolivianos para o Brasil tem chamado atenção nos últimos anos. O quadro a seguir, publicado no jornal Folha de S.Paulo, de 7 de julho de 2013, mostra, entre outros dados, a evolução da imigração boliviana para o Brasil entre 1960 e 2000. Acrescente a essas informações o fato de que a população brasileira em 2000, segundo estimativas do IBGE (Instituto Brasileiro de Geografia e Estatística), era de cerca de 170 milhões de habitantes, contando brasileiros e estrangeiros.
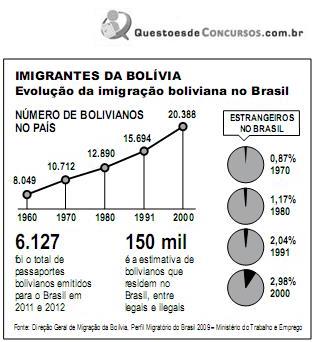
Utilizando-se as informações do gráfico – NÚMERO DE BOLIVIANOS NO PAÍS – e do conjunto de gráficos – ESTRANGEIROS NO PAÍS – para calcular o percentual de bolivianos entre os estrangeiros no Brasil no ano de 2000, verifica-se que esse percentual era de, aproximadamente,
Uma experiência realizada nos EUA com 86 indivíduos, e estando esses indivíduos 2 horas sem comer, mostrou que o risco de acidentes automobilísticos cresce exponencialmente com a quantidade de uísque ingerido. Fazendo-se uma analogia com o vinho, construiu-se a seguinte tabela:
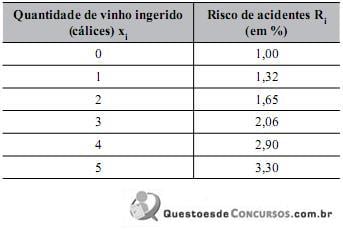
Os dados da tabela permitem dizer que o risco de acidente R(x) cresce exponencialmente em relação à quantidade de vinho ingerida, isto é: R(x) = aebx , onde e é a constante de Euler com valor aproximado de 2,72. Uma regressão linear com os dados da tabela nos dá os valores de a e b bem próximos de 1 e de 0,25, respectivamente, de modo que a função R(x) pode ser assim escrita:
R(x) = e0,25x
(Rodney Carlos Bassanezi, Ensino e Aprendizagem com Modelagem
Matemática: uma nova energia, de editora Contexto, São Paulo, 2004. Adaptado)
Ainda, de acordo com a função R(x), é correto afirmar que, comparando-se o risco da pessoa que bebe n cálices de vinho, com o risco da pessoa que bebe o dobro dessa quantidade, ou seja, 2n cálices,