Questões de Vestibular UFTM 2012 para Vestibular - Prova 1
Foram encontradas 86 questões
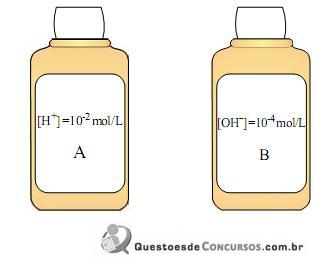
A razão entre os valores de pH da solução B e da solução A, a 25 °C, é
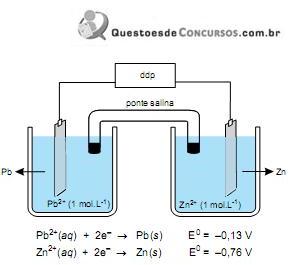
A partir da análise da figura, é correto afirmar que essa pilha tem ddp igual a
(www.saude.rs.gov.br. Adaptado.)
Para enfrentar tal situação, o governo distribuiu para os hospitais públicos o antiviral tamiflu, que tem como princípio ativo o fosfato de oseltamivir. A estrutura do oseltamivir é representada na figura.
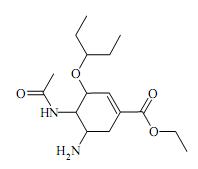
Na estrutura do oseltamivir são encontradas as funções orgânicas
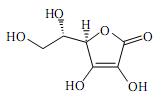
Pode-se afirmar que a vitamina C é um composto
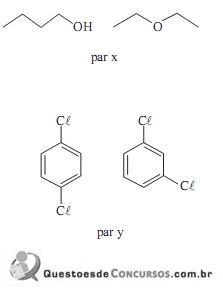
É correto afirmar que os tipos de isomeria encontrada nos pares x e y são, respectivamente,
of the inequality champions
August 22nd, 2012

Brazil might be the leading economy in Latin America and has had a significant performance in reducing poverty in recent years, but it still remains among the countries with the highest inequality in the region together with Guatemala, Honduras and Colombia, points out the UNHabitat report. In all four countries based on 2009 data, the Gini income per capita distribution index stood at 0.56, to which must be added Dominican Republic and Bolivia, two inequality champions with high concentration of wealth. This compares with the US and Portugal Gini indicator of 0.38, two countries that offer no relief since Portugal, for example, has the highest inequality index of the European Union.
Nevertheless, Brazil advanced compared to 1990 when it had the highest degree of inequality and stood well ahead from the rest of the continent. But the region continues to have the highest inequality rate in spite of advances in helping income distribution. Among some of the causes for distribution improvement are productivity, upward trend of salaries and workers categories, strong economy and implementation of income transfer programs in several countries, particularly in the two leading economies, Brazil and Mexico. In the case of Brazil, the country’s economy now figures sixth at global level.
Former president Lula da Silva and one of the most popular leaders in history of that country based his success precisely on the Bolsa Família Plan, which distributed a monthly basic food basket to millions, helping anywhere from 14 to 22 million climb out of poverty, plus ensuring his Workers Party an encouraging future. The Gini coefficient or index measures the inequality among values of a frequency distribution (for instance, levels of income). A Gini coefficient of zero expresses perfect equality where all values are the same (for instance, where everyone has an exactly equal income). A Gini coefficient of one (100 on the percentile scale) expresses maximal inequality among values (for instance, where only one person has all the income).
(http://en.mercopress.com. Adaptado.)